Table of Contents
Azure Monitoring Agent
Azure has rolled out Azure monitoring agent, in aim to replace the existing multiple legacy log agents for all types of resources.
The Azure monitoring agent will collect logs from the integrated resources, and put in the log analytics workspace we need.
Why This Agent
- One single agent to collect data in Azure resources and also from the outside of Azure resources, then to get consolidated view of logs.
- Collect only the logs required, unlike the existing / legacy agents which forces to get all logs or nothing.
- Log collection throughput is higher than the legacy agents.
- The ETL kind of logic is available, where we can sanitize or transform the log during collection and move it the targeted destination.
Azure Monitoring Agent Vs Log Analytics Agent
| ATTRIBUTES | LOG ANALYTICS AGENT | AZURE MONITORING AGENT |
| Log sources | VMs, VMSS and Arc VMs – both for Linux and Windows | VMs, AKS, Azure Functions, App services etc., – collects data from various sources. More getting added by Azure. |
| Support | Ends by August 2024 | Newly introduced, and this agent will replace the existing legacy log agents subsequently over the time. |
| Customizing metrics collected | Collects all the metrics, once agents installed in the services | Data Collection Rules (DCR) configuration as part of installation gives control over the logs being collected. |
| On-premise log collection support | Yes | Yes |
Supported Services
Apart from the supported services which is Generally available, there are few service features supported in public preview
- VM insights
- Microsoft Defender for Cloud
- Microsoft Sentinel
- Network Watcher
Installing Agent
Two methods to install the agent
- Installing agents directly in the Virtual machines.
- In this blog, we will go through the steps required for configuring based on Data Collection Rules (DCR)
DCR (Data Collection Rule) – New
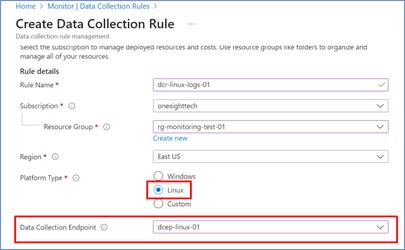
- The DCR can be enabled for both Linux and Windows. The below screen-shot shows on steps to create DCR for Linux

- Choose “Platform Type” as “Linux”, and choose data collection endpoint (this is optional).
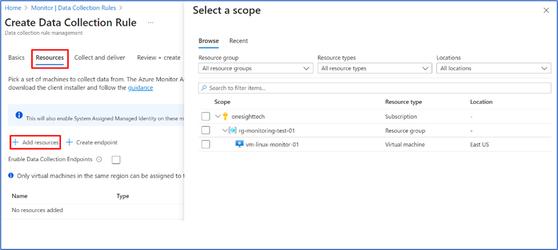
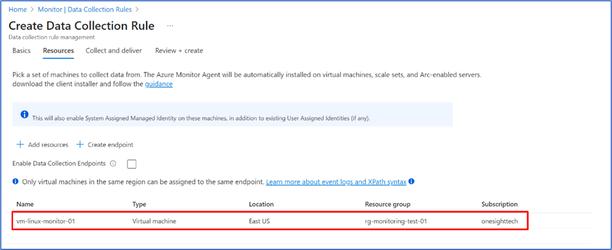
- Go to “Resources” section and choose the scope. In this case there is only one VM is there, so selecting that as a sample.
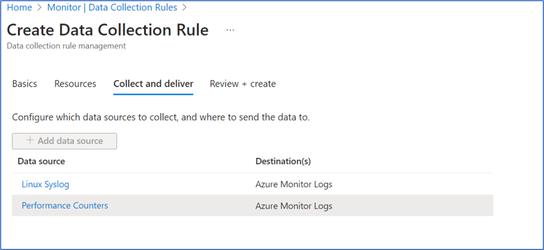
- Go to “Collect and deliver” and choose Data source. In that data-source choose “Linux Syslog” as option, and you can choose other data-source types as well.
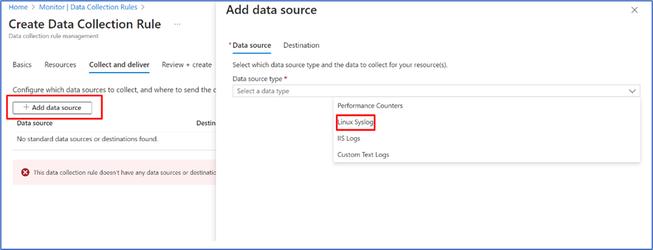
- The chosen “Collect and deliver” shown below.
DCR (Data Collection Rules) – Created
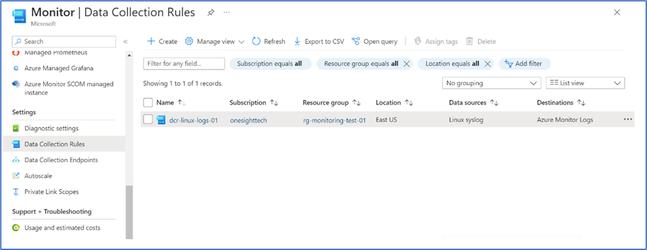
The created DCR displayed below for showing the details
- Created DCR for Linux VM shown below
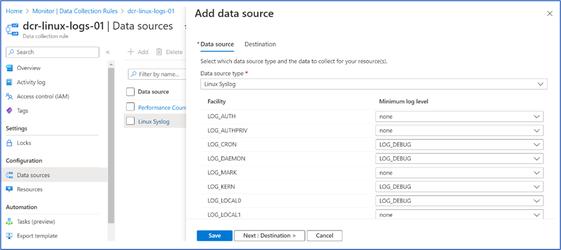
- In the collection rule, data sources are shown below
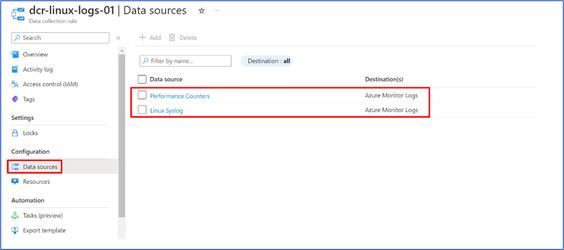
- The Syslog metrics planned for capturing under the “Data source”
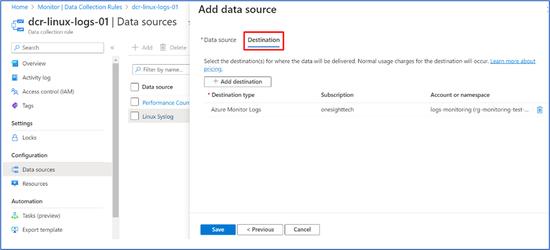
- The “Destination” will be the log analytics workspace.
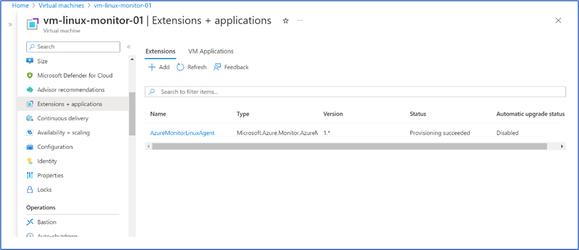
- The Virtual machine will have extensions related to Azure Monitoring Agent, which is “AzureMonitorLinuxAgent”. As you can see the “Automatic upgrade status” is in “Disabled” mode. In this case latest agent will not be updated, if there is any upgrades release by Azure.
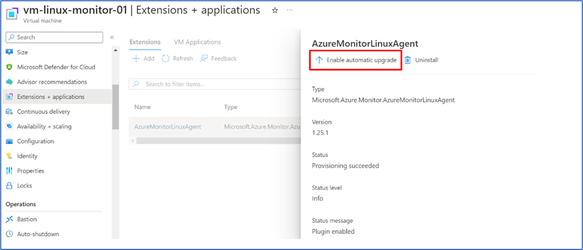
- The automatic upgrade can be enabled, by going to the detailed detail
Configured Log Analytics Workspace
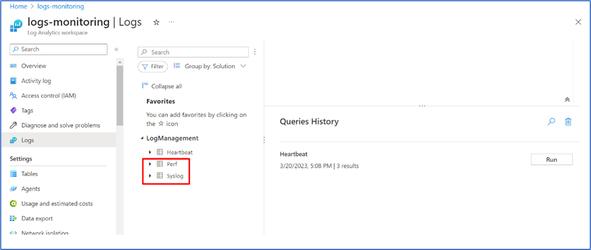
The target log analytics workspace, which showing the logs – Perf and Syslogs shown below. These tables can be used for monitoring the Virtual Machine (s) configured.
